Draw A Bar Chart
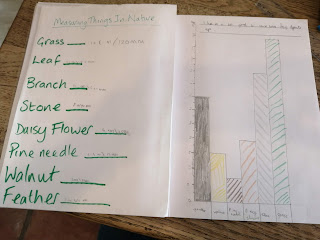
Draw a bar chart of the length of objects you have measured either in the house or from the garden.
We used the measurements from objects in nature we had measured on a walk down our lane. https://teachingandhomeschoolingideas.blogspot.com/2020/04/measuring-in-nature.html?m=1
I drew the axes and Thomas labelled them.
The lengths were drawn in mm going up in 10s. (Chance to practise 10x table!)
I measured two centimetres for each 10mm and so could put a mark for every 5mm as we had an object that measured 15mm.
Once axes are drawn and labelled, then draw the bars at the correct length. Colour in each bar a different colour.
We gave our barchart a title - This Is A Bar Graph To Show The Lengths Of Objects.


Comments
Post a Comment